Fiscal Flows, Bank Credit, And The Fed For July
June 2025 fiscal flows were weak, extracting $2B from the private sector, signaling short-term market caution and likely negative SPX performance for July.
Jul. 11, 2025 11:58 PM ET
Includes: ACTV, AFMC, AFSM, ARKK, AVUV, BAPR, DJI, GBTC, IVOO, IVOV, IVV, IVW, IWC, IWM, IWN, IWO, IWP, IWR, IWS, IYY, MAGS, MSCI, NDX, QQQ, SP500, SPLV, SPMD, SPMO, SPMV, SPSM, SPUS, SPUU, SPVM, SPVU, SPX, SPXE, SPXL, SPXN, SPXS, SPXT, SPXU, SPXV, SPY, SPYD, SPYG, SPYV, SPYX, SQEW, SQLV, SSO, SSPY, SVAL, SYLD, TMDV, TPHD, TPLC, TPSC, UAUG, UJAN, UMAR, UMAY, UOCT, UPRO, USMC, USMF, USVM, VMFVX, VSPMX, XLF
Macroeconomics, Long/Short Equity, Deep Value, Long-Term Horizon
Summary
June 2025 fiscal flows were weak, extracting $2B from the private sector, signaling short-term market caution and likely negative SPX performance for July.
The passing of the federal budget and debt limit increase unlocks significant liquidity, setting the stage for a strong rally later in the year.
Fed rate cuts and resumed government spending are bullish for risk assets, but global fiscal contraction and trade policy uncertainty warrant caution until Q4.
Expect a flat market through September, with a potential year-end rally as fiscal and monetary conditions improve and seasonal trends turn favorable.
Introduction
With equity markets teetering between bullish liquidity injections and global policy tightening, this article unpacks June 2025's fiscal flows to forecast risk asset performance into Q3.
Fiscal flows reflect the movement of money between the federal government, private sector, and external sector. Positive flows support market liquidity, while negative flows tighten liquidity.
Fiscal flow information in valuable for trading as it can often predict market moves a month or more ahead due to the lagged impact of a flow now on risk market assets later.
Mapping the June Sectoral Balances
The sectoral balances framework divides the economy into three main sectors: the government sector, the private sector (households and businesses), and the foreign sector (rest of the world). The balances among these sectors must sum to zero:
(Government Balance) + (Private Sector Balance) + (Foreign Sector Balance) = 0
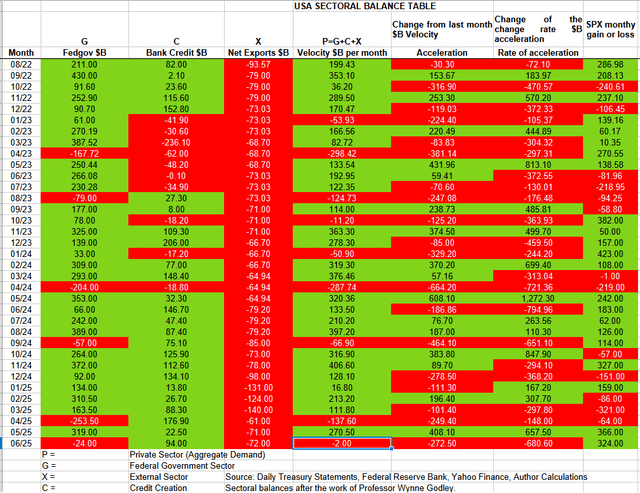
The table below shows the sectoral balances for the US, which are produced from the national accounts.
June is seasonally a bad month for fiscal flows due to the federal tax collection in the middle of the month. June saw a -$2 billion extraction of funds from the private sector.
This marks a $272B swing from May's +$270B injection, driven by accelerated tax receipts and muted discretionary outlays.
Going into detail: The -$2 billion private sector funds deficit came from a -$24 Billion extraction of funds by the federal government.
The banking sector contributed a much improved $94 billion. The big boost in credit expansion from the relaxation of Global Financial Crisis [GFC] 2008 era lending restrictions could now be taking effect.
The chart below shows that most types of credit creation grew during the month.
The chart above shows how the SPX tends to move upwards with credit creation and that credit creation may pause but rarely drops.
The external sector is forecast to extract about -$72 billion from the private domestic sector and deposit it into foreign-held bank accounts at the Fed (the external sector X) in return for imported goods and services. The current administrations trade policies have been successful in reducing the trade deficit so that other countries are no longer exchanging real resources for fiat dollar book entries at the Federal reserve bank.
Market Implications
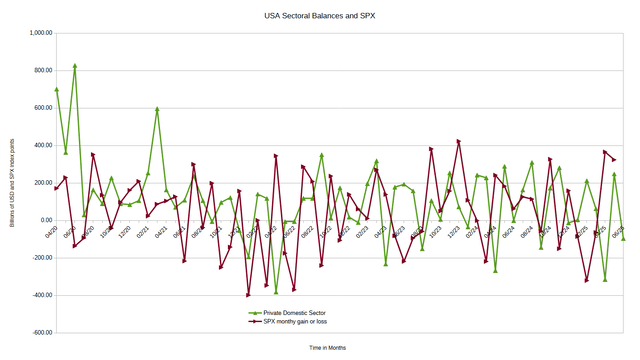
The chart below shows the sectoral balance data plotted in nominal terms. The calculation is federal government spending or G plus the external sector (X and usually a negative factor). The result is how much money enters or leaves the private domestic sector or P, an accounting identity true by definition.
Last month the green fiscal flow line predicted the SPX would finish the month higher than it began based purely on the strength of the fiscal flows. This prediction has proven true.
This month the green fiscal flow line is in negative territory and therefore predicting the market will finish the month lower than it began.
Monetary Policy Outlook
The table below shows the total federal government withdrawals from their accounts at the Federal Reserve Bank. A withdrawal by the federal government is a receipt/credit for the private sector and, therefore, a positive for asset markets.
The table shows that total Federal government outlays were weaker month over month. We now have two consecutive months of weaker federal spending. This month the weak federal spending was reinforced with a budget surplus and this shows that less was spent and more was taxed out thus making for a private sector deficit.
Fiscal milestones coming up:There are no more large federal taxation events until September. This allows financial assets in the private sector to steadily grow and recover. This will be helped by a large treasury interest payment in the middle of August and then a smaller one at the end of August. There is now a general background of rising macro system liquidity.
At the White House, the Big Beautiful Budget Bill has been passed as planned for July the 4th. This is a very important financial hurdle that has been cleared. The debt limit has been raised and this will allow the money supply to grow out to over $41 trillion.
The table above is taken from the most recent Daily Treasury Statement and shows the new Statutory Debt Limit in the last line. A growing economy needs a growing money supply as do risk asset markets and this now has a Federal guarantee the supply can be maintained.
In my last article I wrote the following:
There are some hurdles still to clear such as:
Lift or suspend the debt limit.
2. Pass the new Federal budget.
3. Stabilize the trade war.
4. Stabilize POTUS erratic foreign policy.
(Source: Alan Longbon, Seeking Alpha)
Hurdles 1 and 2 have been cleared.
There will now be a huge backlog creation of treasuries to cover the internal book adjustments that were done to "fund" the Federal govt and to fund the federal govt going forward.
Treasuries creation by way of "debt issuance" is the carrier wave that drives all other higher frequency waves such as the stock, bond, real estate and risk asset markets in general. These all rise now mechanically and not just on sentiment but from real financial liquidity hydraulics.
All the federal agencies that were holding back spending for fear of running out of approved budget can now spend again and will do so all at once with gusto.
This together with fed rate cuts is very bullish in the short term.
The chart below shows in the regions outlined in green boxes with broken lines the last three debt limit episodes. The first two show how when the debt limit was lifted the black line (debt held by the public ie treasuries) shot back up and generally took asset prices with them. The black slashed line at the end of the chart shows the likely future trajectory of debt held by the public. Debt held by the public is a leading co factor and will drive the other co factors higher with a lag of up to one year later.
If the market can stomach the recent new tariff threats better than it did last April during the Liberation Day fiasco it has scope to rise strongly from here.
The Federal Reserve concluded its June 2025 meeting, leaving unchanged its overnight borrowing rate in a range between 4.25%-4.5%.
The next meeting is at the end of this month.
The following chart plots key indicators used to estimate what the Fed might do next and has proven very predictive.
The federal funds rate [FFR] is led by a multitude of co-factors, and these are listed and discussed below.
1. The red SPX line is recovering from the Liberation Day bad sentiment event and rising.
2. The green CPI line is falling and is on a downward general trajectory.
3. The pink change rate of the 10-year bond yield has risen but generally describes a falling trajectory. While the purple actual 10 year bond rate has ticked upward along a generally shallow rising trajectory.
4. The dark green growth rate of GDP has fallen.
5. The brown unemployment rate has ticked up (shown inverted) pointing to less unemployment short term along a generally shallow falling trajectory toward more rather than less unemployment.
6. The black non farm payrolls rate of change is in a shallow descent.
Most factors point to the Fed lowering the rate in the near future which is what POTUS wants as well. The pressure on the Fed Chair to lower rates must be immense.
Lowering rates would quixotically also lower inflation given that there is an element of credit cost build into the price of all goods and services. If the cost of credit is lowered then prices generally will follow.
Global Macroeconomic Trends:
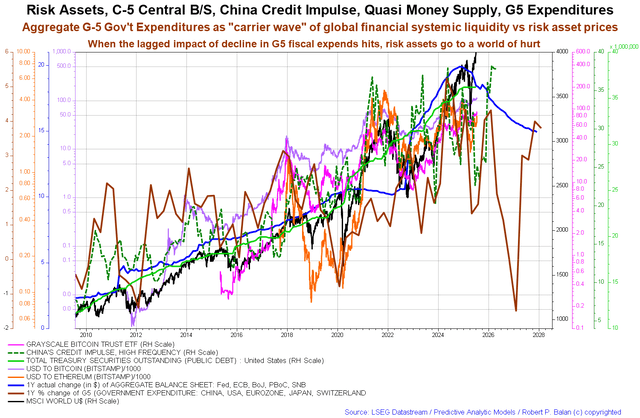
At the world macroeconomic level, we have the G5 and C5 chart below. The chart shows the spending level by the top five world governments (the G5) in a change rate format together with a range of risk assets such as crypto (GBTC), and the stock market (MSCI). The C5 are the balance sheets of the five largest central banks.
The most important line on the above chart is the brown one. The brown line shows the combined spending of the worlds largest governments. This is a change rate chart. While the brown G5 line shows a large drop at this time in terms of its change rate it is still moving in positive territory. In 2027 the even deeper drop moves G5 spending into negative contractionary territory. Negative spending at this level has occurred only in 2009 and again in 2012, in the time shown on this chart, in the wake of the end of the Global Financial Crisis and large stock market declines.
The depth and sharpness of the big dip in 2027 has increased since last month as more data has come to hand.
The blue line of central bank balance sheets holdings continues to fall as they shed assets back to the private sector and tighten monetary conditions. The lagged impact of this policy stretches years into the future and leads risk asset prices by over 18 months. The brown G5 line leads risk asset markets by almost two years.
Conclusion and Recommendations
The national fiscal flows are weak and so is the global background and calls for caution until the last quarter of this year where the brown G5 spending line above starts to rise again into 2026.
There are some hurdles still to clear such as:
1. Stabilize the trade war.
2. Stabilize POTUS erratic foreign policy.
With a strong fiscal background the tide of rising risk asset prices driven by rising financial system liquidity can weather the negative sentiment waves created by POTUS trade and foreign policy.
The 20 year seasonal averages shown in the chart above point to flat markets during the rest of summer and a risk asset market rally at the end of the year.
The table below summarizes the market outlook.
Analyst’s Disclosure: I/we have no stock, option or similar derivative position in any of the companies mentioned, and no plans to initiate any such positions within the next 72 hours.
I wrote this article myself, and it expresses my own opinions. I am not receiving compensation for it except from Substack. I have no business relationship with any company whose stock is mentioned in this article.
Selling real estate and long cash
Disclosure: Past performance is no guarantee of future results. No recommendation or advice is being given as to whether any investment is suitable for a particular investor.


II appreciate the listing of fiscal flows. Very helpful. If rates are lowered the trillions sitting in money-market funds will find a new home. Wouldn’t this also be consumer deflationary, since less interest earned, which usually gets spent into the economy…?